![]()
The Ultimate CompTIA DA0-001 Dumps PDF Review
Achieve The Utmost Performance In DA0-001 Exam Pass Guaranteed
CompTIA DA0-001 exam is intended for individuals who are seeking to enhance their skills in data management and demonstrate their mastery of industry-standard data management practices. CompTIA Data+ Certification Exam certification is ideal for professionals in data management roles, such as data analysts, database administrators, data architects, and data engineers. It is also suitable for IT professionals who want to expand their knowledge in data management and pursue new career opportunities in this field. Passing the CompTIA DA0-001 exam will demonstrate to employers that you have the necessary skills and knowledge to manage data effectively and securely, and that you are committed to maintaining the highest standards of data management practice.
NEW QUESTION # 52
Kelly wants to get feedback on the final draft of a strategic report that has taken her six months to develop.
What can she do to get prevent confusion as see seeks feedback before publishing the report?
Choose the best answer.
- A. Distribute the report to the appropriate stakeholders via email.
- B. Use a watermark to identify the report as a draft.
- C. Publish the report on an internally facing website.
- D. Show the report to her immediate supervisor.
Answer: B
Explanation:
While Kelly needs feedback from the appropriate stakeholders, doing so without a watermark could lead them to believe the report they receive is the final product.
NEW QUESTION # 53
Which one the following is not considered an aggregate function?
- A. MAX
- B. SUM
- C. MIN
- D. SELECT
Answer: D
Explanation:
The option that is not considered an aggregate function is SELECT. An aggregate function is a function that performs a calculation on a set of values and returns a single value. Examples of aggregate functions are SUM, MIN, MAX, AVG, COUNT, etc. SELECT is not an aggregate function, but a SQL command that is used to select data from a table or a query. Reference: SQL Aggregate Functions - W3Schools
NEW QUESTION # 54
The current date is July 14, 2020. A data analyst has been asked to create a report that shows the company's year-over-year Q2 2020 sales. Which of the following reports should the analyst compare?
- A. YTD 2020 and YTD 2019
- B. Q2 2020 and Q4 2019
- C. Q2 2020 and Q2 2021
- D. Q2 2020 and Q2 2019
Answer: D
Explanation:
Year-over-year (YoY) comparison is a method of evaluating two or more measured events to compare the results at one period with those from a comparable period on an annual basis. For a year-over-year comparison of Q2 2020 sales, the analyst should compare the sales figures from Q2 2020 with those from Q2 2019. This comparison will show the growth, stagnation, or decline in sales over the year and is a common practice in financial analysis to assess performance.
Reference:
SlideTeam's article on sales comparison templates1.
Salesforce help article on calculating YoY or Quarter-over-Quarter (QoQ) in reports2.
Smartsheet's content on annual sales report templates3.
TechRepublic article on creating a YoY comparison chart using a PivotChart in Excel4.
NEW QUESTION # 55
A data analyst has been asked to derive a new variable labeled "Promotion_flag" based on the total quantity sold by each salesperson. Given the table below: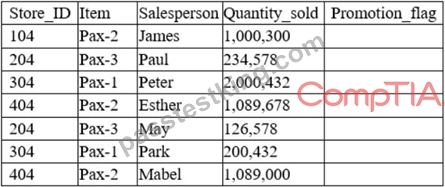
Which of the following functions would the analyst consider appropriate to flag "Yes" for every salesperson who has a number above 1,000,000 in the Quantity_sold column?
- A. Aggregate
- B. Logical
- C. Mathematical
- D. Date
Answer: A
NEW QUESTION # 56
A database administrator needs to ensure only approved users can access specific database tables to perform financial functions. Which of the following is the best access control method for the administrator to use?
- A. Role-based
- B. Rule-based
- C. Group-based
- D. Discretionary
Answer: A
NEW QUESTION # 57
A data analyst is creating a dashboard and trying to identify the type of information that should be included.
Which of the following should the analyst consider first?
- A. Access permissions
- B. Consumer types
- C. Data sources and attributes
- D. Data refresh rate
Answer: C
Explanation:
The answer is D. Data sources and attributes.
Short explanation: The data analyst should consider the data sources and attributes first when creating a dashboard, because they determine what kind of information can be included and how it can be displayed.
The data sources and attributes define the origin, quality, format, and structure of the data that will be used for the dashboard.They also affect the data refresh rate, the consumer types, and the access permissions of the dashboard12 A: Data refresh rate is not the first thing to consider, because it depends on the data sources and attributes.
The data refresh rate is how often the data in the dashboard is updated or refreshed to reflect the latest changes.
The data refresh rate can vary depending on the type, frequency, and availability of the data sources1 B: Consumer types are not the first thing to consider, because they depend on the data sources and attributes.
The consumer types are the intended audiences or users of the dashboard, who may have different needs, preferences, and expectations for the dashboard. The consumer types can influence the design, layout, and functionality of the dashboard.However, the consumer types cannot be determined without knowing what kind of data is available and relevant for them1 C: Access permissions are not the first thing to consider, because they depend on the data sources and attributes. The access permissions are the rules or policies that govern who can view, edit, or share the dashboard. The access permissions can protect the confidentiality, integrity, and availability of the data in the dashboard.However, the access permissions cannot be set without knowing what kind of data is involved and who needs to access it1
NEW QUESTION # 58
Given the diagram below: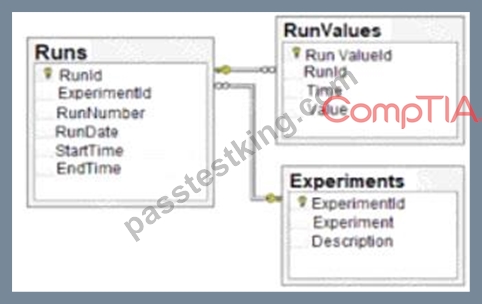
Which of the following data schemas shown?
- A. Data Lake
- B. Relational database
- C. Online transactional processing
- D. Key-value pairs
Answer: B
Explanation:
Explanation
A relational database is a type of database that organizes data into tables, where each table has a fixed number of columns and a variable number of rows. Each row in a table represents a record or an entity, and each column represents an attribute or a property of that entity. The tables are linked by common fields, called keys, which enable the database to establish relationships between the data. A relational database schema is a diagram that shows the structure and organization of the tables, columns, keys, and constraints in a relational database. The diagram given in the question is an example of a relational database schema, as it shows two tables: "Runs" and "Experiments", with their respective columns, data types, and primary keys. The "Runs" table also has a foreign key that references the "ExperimentId" column in the "Experiments" table, indicating a relationship between the two tables. Therefore, the correct answer is D. References: What is a database schema? | IBM, Database Schema - Javatpoint
NEW QUESTION # 59
Five dogs have the following heights in millimeters:
300,430, 170, 470, 600
Which of the following is the standard deviation for the five dogs?
- A. 21,704mm
- B. 394 mm
- C. 147mm
- D. 154mm
Answer: D
Explanation:
The correct answer is B. 154 mm.
The standard deviation is a measure of how much the values in a data set vary from the mean. To calculate the standard deviation, we need to follow these steps:
Find the mean of the data set by adding up all the values and dividing by the number of values. In this case, the mean is (300 + 430 + 170 + 470 + 600) / 5 = 394 mm.
Find the difference between each value and the mean, and square it. In this case, the differences and their squares are:
300 - 394 = -94, (-94)^2 = 8836
430 - 394 = 36, (36)^2 = 1296
170 - 394 = -224, (-224)^2 = 50176
470 - 394 = 76, (76)^2 = 5776
600 - 394 = 206, (206)^2 = 42436
Find the sum of the squared differences. In this case, the sum is 8836 + 1296 + 50176 + 5776 + 42436 = 108520.
Divide the sum by the number of values. In this case, the result is 108520 / 5 = 21704. This is called the variance.
Take the square root of the variance. In this case, the result is sqrt(21704) = 147.32 mm. This is called the standard deviation.
Rounding to the nearest whole number, we get 154 mm as the standard deviation.
NEW QUESTION # 60
A data analyst is creating a report that will provide information about various regions, products, and time periods. Which of the following formats would be the MOST efficient way to deliver this report?
- A. A daily email with snapshots of regional summaries
- B. A static report with a different page for every filtered view
- C. A workbook with multiple tabs for each region
- D. A dashboard with filters at the top that the user can toggle
Answer: D
Explanation:
Explanation
A dashboard with filters at the top that the user can toggle would be the most efficient way to deliver this report, because it allows the user to customize the view and explore different combinations of regions, products, and time periods. A workbook with multiple tabs for each region would be cumbersome and repetitive. A daily email with snapshots of regional summaries would not provide enough detail or interactivity. A static report with a different page for every filtered view would be too long and hard to navigate. References: CompTIA Data+ Certification Exam Objectives, page 14
NEW QUESTION # 61
A customer list from a financial services company is shown below: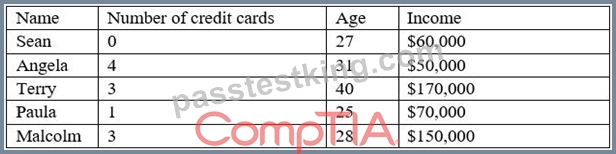
A data analyst wants to create a likely-to-buy score on a scale from 0 to 100, based on an average of the three numerical variables: number of credit cards, age, and income. Which of the following should the analyst do to the variables to ensure they all have the same weight in the score calculation?
- A. Calculate the standard deviations of the variables.
- B. Calculate the percentiles of the variables.
- C. Normalize the variables.
- D. Recode the variables.
Answer: C
NEW QUESTION # 62 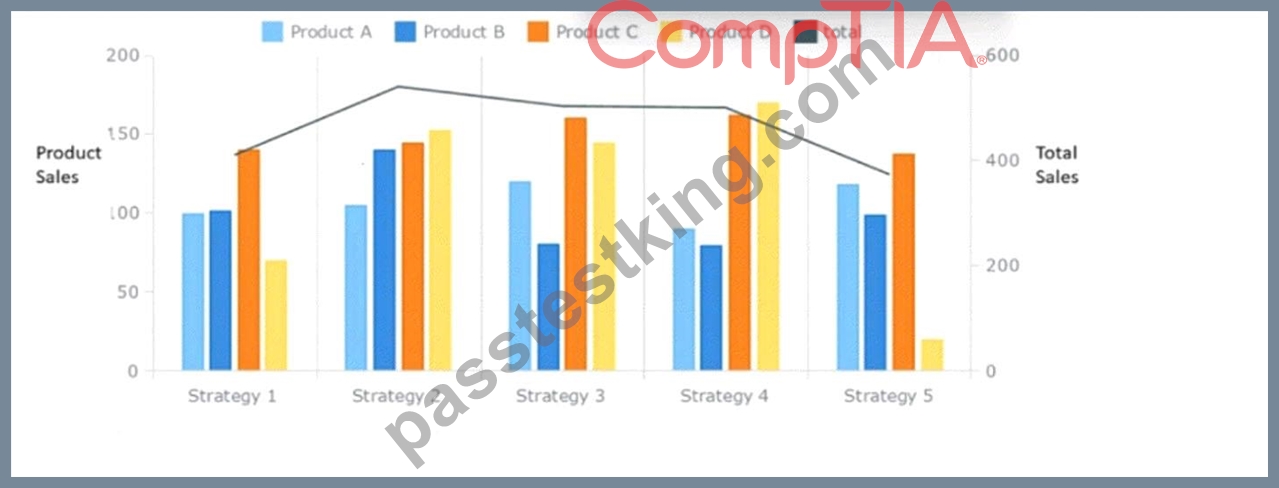
Which of the following summary statements upholds integrity in data reporting?
- A. Strategy 4 provides the best sales in comparison to other strategies.
- B. Sales are approximately equal for Product A and Product B across all strategies.
- C. Product D should be promoted more than the other products in all strategies.
- D. While Strategy 2 does not result in the highest sales of Product D. over all products it appears to be the most effective.
Answer: D
Explanation:
While Strategy 2 does not result in the highest sales of Product D. over all products it appears to be the most effective.
A summary statement that upholds integrity in data reporting should be accurate, unbiased, and supported by evidence. Option C is the only statement that meets these criteria, as it reflects the data shown in the bar graph without exaggerating or distorting it. Option C also acknowledges the limitation of the statement by using the word "appears", which indicates that there may be other factors or variables that affect the sales performance.
Option A is inaccurate, as sales are not approximately equal for Product A and Product B across all strategies.
Product A has higher sales than Product B in strategies 1, 3, and 5, while Product B has higher sales than Product A in strategies 2 and 4.
Option B is biased, as it does not consider the sales of different products in each strategy. Strategy 4 provides the best sales for Product B, but not for the other products. Strategy 5 has the highest total sales across all products, as shown by the black line graph.
Option D is unsupported by evidence, as it does not explain why Product D should be promoted more than the other products in all strategies. Product D has the lowest sales among all products in strategies 1, 3, and 4, and only slightly higher sales than Product C in strategies 2 and 5.
NEW QUESTION # 63
Given the image below: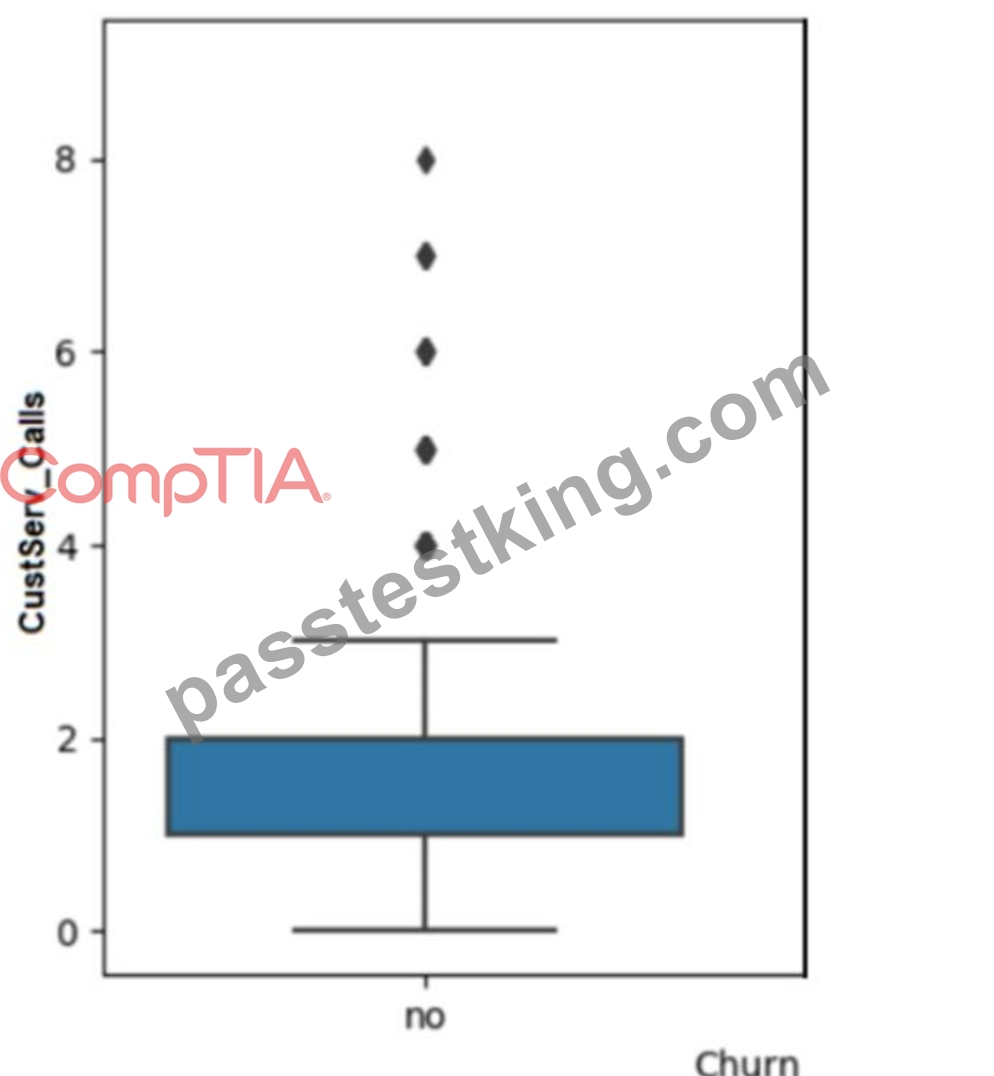
The data should be cleaned because of the presence of:
- A. invalid data.
- B. multicollinearity.
- C. non-parametric data.
- D. outlier
Answer: D
Explanation:
The answer is A. Outlier.
Short explanation: An outlier is a data point that differs significantly from the rest of the data in a dataset. An outlier can indicate an error, an anomaly, or a rare event in the data.An outlier can affect the statistical analysis and visualization of the data, such as skewing the mean, variance, or distribution of the data. Therefore, data should be cleaned to identify and remove or correct any outliers.
The image below shows a box plot graph with a vertical axis labeled "Customer Calls" and a horizontal axis labeled "Churn". The box plot is blue in color and the median value is around 2. There are 7 outliers above the box plot, ranging from 4 to 8.
image)
A box plot is a type of graph that can show the distribution of data values using five summary statistics: minimum, maximum, median, first quartile, and third quartile. The box represents the interquartile range (IQR), which is the difference between the first and third quartiles. The median is shown as a line inside the box. The whiskers extend from the box to the minimum and maximum values, excluding any outliers. Outliers are shown as dots or circles outside the whiskers.
In this graph, we can see that most of the customer calls are between 0 and 4, with a median of 2. However, there are 7 outliers that have more than 4 customer calls, up to 8. These outliers may indicate some customers who have more issues or complaints than others, or some errors or anomalies in the data collection or recording process. These outliers can affect the analysis and interpretation of the customer calls and churn relationship, such as making it seem that more customer calls lead to less churn, which may not be true for the majority of the customers. Therefore, data should be cleaned to investigate and handle these outliers appropriately.
NEW QUESTION # 64
Which of the following is a common data analytics tool that is also used as an interpreted, high-level, general-purpose programming language?
- A. SAS
- B. Microsoft Power BI
- C. Python
- D. IBM SPSS
Answer: C
Explanation:
Python is a common data analytics tool that is also used as an interpreted, high-level, general-purpose programming language. Python has a simple and expressive syntax that makes it easy to read and write code. Python also has a rich set of libraries and frameworks that support various tasks and applications in data analytics, such as data manipulation, visualization, machine learning, natural language processing, web scraping, and more. Some examples of popular Python libraries for data analytics are pandas, numpy, matplotlib, seaborn, scikit-learn, nltk, and beautifulsoup. Python is different from other data analytics tools that are not programming languages but rather software applications or platforms that provide graphical user interfaces (GUIs) for data analysis and visualization. Some examples of these tools are SAS, Microsoft Power BI, IBM SPSS. Therefore, the correct answer is D. Reference: [What is Python? | Definition and Examples], [Python Libraries for Data Science]
NEW QUESTION # 65
Given the following graph: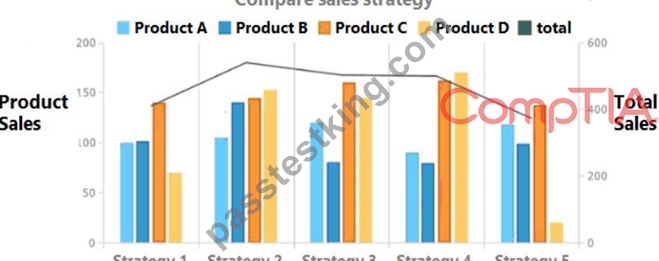
Which of the following summary statements upholds integrity in data reporting?
- A. Sales are approximately equal for Product A and Product B across all strategies.
- B. Strategy 4 provides the best sales in comparison to other strategies.
- C. Product D should be promoted more than the other products in all strategies.
- D. While Strategy 2 does not result in the highest sales of Product D, over all products it appears to be the most effective.
Answer: B
Explanation:
Strategy 4 provides the best sales in comparison to other strategies. This is because the total sales for Strategy
4 are the highest among all the strategies, as shown by the black line. The other statements are not accurate or do not uphold integrity in data reporting. Here is why:
Statement A is false because sales are not approximately equal for Product A and Product B across all strategies. For example, in Strategy 1, Product A has more sales than Product B, while in Strategy 3, Product B has more sales than Product A.
Statement C is misleading because it does not account for the difference in scale between the products. While Strategy 2 has the highest total sales among all products, it does not necessarily mean that it is the most effective for each product. For instance, Product D has very low sales in Strategy 2 compared to other strategies.
Statement D is biased because it does not provide any evidence or justification for why Product D should be promoted more than the other products in all strategies. It also ignores the fact that Product D has the lowest sales among all products in most of the strategies.
NEW QUESTION # 66
The number of phone calls that the call center receives in a day is an example of:
- A. categorical data.
- B. ordinal data.
- C. continuous data.
- D. discrete data.
Answer: D
Explanation:
Discrete data is a type of data that can only take certain values, usually whole numbers or integers. Discrete data can be counted, but not measured. For example, the number of students in a class, the number of books in a library, or the number of phone calls that a call center receives in a day are all examples of discrete data. Discrete data is different from continuous data, which can take any value within a range, and can be measured with precision. For example, the height of a person, the weight of a fruit, or the temperature of a room are all examples of continuous data. Therefore, the correct answer is D. Reference: [Discrete vs Continuous Data: Definition and Examples - Statistics How To], [Discrete Data - Definition and Examples | Math Goodies]
NEW QUESTION # 67
An analyst needs to join two data sets that compare vehicle weights. One data set is in pounds, and the other has various units of measure. Which of the following should the analyst do first to the data prior to any type of join?
- A. Reduce
- B. Normalize
- C. Concatenate
- D. Blend
Answer: B
Explanation:
Comprehensive and Detailed In-Depth Explanation:
Before merging (joining) two datasets, it is crucial to ensure that theunits of measurement are consistentto maintain accuracy and comparability. This process is callednormalization.
* Option A (Blend):Incorrect. Blending is used to combine data from multiple sources but does not standardize unit measurements.
* Option B (Reduce):Incorrect. Reducing data refers to filtering or aggregating data, which does not address unit inconsistencies.
* Option C (Concatenate):Incorrect. Concatenation combines datasets without standardizing units, leading to inconsistent data.
* Option D (Normalize):Correct.Normalization ensures that all values in a dataset are converted to a common scale (e.g., converting kilograms to pounds) before performing operations like joins.
NEW QUESTION # 68
An organization wants to evaluate whether project activities are within the set projections and in line to meet the desired project targets. Which of the following types of analysis is best suited for this situation?
- A. Trend analysis
- B. Descriptive analysis
- C. Performance analysis
- D. Exploratory analysis
Answer: C
Explanation:
Comprehensive and Detailed In-Depth Explanation:
Performance analysisis used toassess whether activities, projects, or processes are meeting predefined goals. It compares actual performance against benchmarks or expectations.
* Option A (Trend analysis):Incorrect. Trend analysis looks at data over time to identify patterns or movements, but it does not measure progress against goals.
* Option B (Performance analysis):Correct.This type of analysis is specifically used toevaluate progress against projections and targets.
* Option C (Descriptive analysis):Incorrect. Descriptive analysis summarizes historical data but does not evaluate whether targets are being met.
* Option D (Exploratory analysis):Incorrect. Exploratory analysis is used todiscover patterns and anomaliesrather than to track progress against predefined objectives.
NEW QUESTION # 69
A data analyst for a media company needs to determine the most popular movie genre. Given the table below: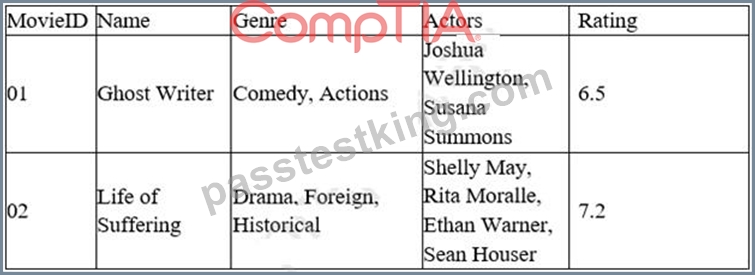
Which of the following must be done to the Genre column before this task can be completed?
- A. Append
- B. Delimit
- C. Merge
- D. Concatenate
Answer: B
Explanation:
The action that must be done to the Genre column before this task can be completed is delimit. Delimit is a process of separating or splitting a string of text into multiple parts based on a delimiter, which is a character or a sequence of characters that marks the boundary between the parts. For example, a comma (,) or a semicolon (;) can be used as a delimiter. In this case, the Genre column contains multiple genres for each movie, separated by commas. To determine the most popular movie genre, the data analyst needs to delimit the Genre column by commas, so that each genre can be counted and compared separately. The other options are not relevant for this task, as they are related to combining or joining strings or tables, not separating them. Append is a process of adding or attaching one string or table to the end of another string or table. Merge is a process of combining or joining two or more tables into one table based on a common column or key. Concatenate is a process of joining or linking two or more strings together into one string. Reference: [How to Split Text in Excel - Exceljet]
NEW QUESTION # 70
Which of the following actions should be taken when transmitting data to mitigate the chance of a data leak occurring? (Choose two.)
- A. Data masking
- B. Fata removal
- C. Data reporting
- D. Data encryption
- E. Data identification
- F. Data processing
Answer: A,D
NEW QUESTION # 71
A data analyst needs to present the results of an online marketing campaign to the marketing manager. The manager wants to see the most important KPIs and measure the return on marketing investment. Which of the following should the data analyst use to BEST communicate this information to the manager?
- A. A real-time monitor that allows the manager to view performance the day the campaign was launched
- B. A spreadsheet of the raw data from all marketing campaigns and channels
- C. A summary with statistics, conclusions, and recommendations from the data analyst
- D. A sell-service dashboard that allows the manager to look at the company's annual budget performance
Answer: C
Explanation:
The option that the data analyst should use to best communicate the information to the manager is a summary with statistics, conclusions, and recommendations from the data analyst. A summary is a concise and clear way of presenting the main findings and insights from the data analysis report. A summary should include relevant statistics that support the conclusions and recommendations from the data analyst. A summary should also highlight the most important KPIs and measure the return on marketing investment in relation to the objectives of the online marketing campaign. The other options are not as effective as using a summary to communicate the information to the manager, as they either provide too much or too little information or do not address the manager's needs or expectations. A real-time monitor may provide too much information that can be overwhelming or distracting for the manager who wants to see only the most important KPIs and measure the return on marketing investment. A self-service dashboard may provide too little information that can be insufficient or unclear for the manager who wants to see some guidance and interpretation from the data analyst. A spreadsheet of raw data may provide irrelevant or inaccurate information that can be confusing or misleading for the manager who wants to see some analysis and insights from the data analyst. Reference: [How to Write an Executive Summary for Your Data Analysis Report - Towards Data Science]
NEW QUESTION # 72
An analyst needs to summarize the number of people in Chicago in 2022 using the following set of data: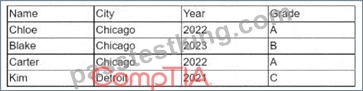
Which of the following steps should the analyst use to provide results? (Select two).
- A. Aggregation
- B. Indexing
- C. Sorting
- D. Filtering
- E. Cleaning
- F. Replacing
Answer: A,D
NEW QUESTION # 73
......
Achive your Success with Latest CompTIA DA0-001 Exam: https://www.passtestking.com/CompTIA/DA0-001-practice-exam-dumps.html
The DA0-001 Exam Test For Brief Preparation: https://drive.google.com/open?id=1PZJHJNyItpWjzazUk1EzN_eHxlhOtlV-